Tuesday, April 24, 2012

GAO Faults Medicare Advantage Bonuses


Today’s Managing Health Care Costs Indicator is $8.35 billion


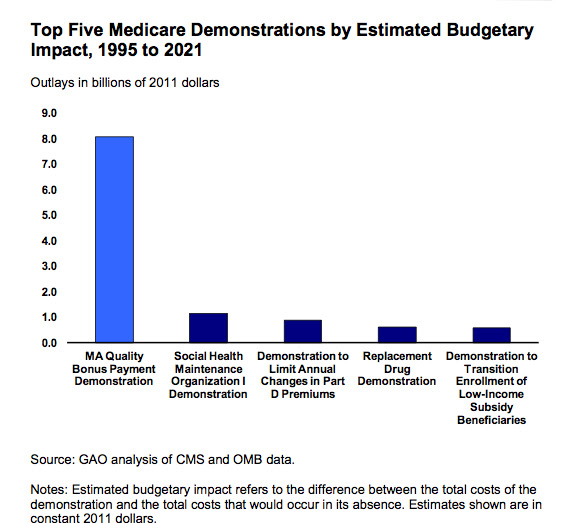
Yesterday the Government Accountability Office (GAO) issued a stinging report on the CMS demonstration project that awards much higher quality bonuses to Medicare Advantage (MA) plans than were outlined in the Affordable Care Act.    The total incremental cost of these bonuses will be $8.35 billion over 10 years.  Most of the increased dollars will go to health plans with “average”  three star ratings (in the five star system).    The remainder of the dollars are spent because these bonuses will prevent loss of membership by MA plans.   The GAO reports that the population covered by bonuses will increase from about 1/3 of beneficiaries to about 90%. This analysis is based on a Kaiser Family Foundation analysis,which notes that 60% of MA beneficiaries were in 3 and 3.5 star plans in 2011.

These quality bonuses will be based on past performance ,  in many instances performance that predated the announcement of the demonstration project. This means that it will be almost impossible to assess the quality impact.  The demonstration project is not budget neutral, and wipes out about 1/3 of the savings that the Affordable Care Act obtained from cutting health plan payments. The total dollar amount exceeds all other CMS demonstration projects combined.

It’s a scathing report –but the stock market reacted not at all.   Humana, United Health Care, Aetna Cigna and Wellpoint all had just small changes in their stock price – not in a consistently downward direction.  It’s possible that Wall Street already knew this information – since the KFF report came out last year.  It’s likely that analysts believe that the Department of Health and Human Services will not follow the GAO recommendations, and this poorly-designed demonstration project with these extra payments will continue.

Monday, April 23, 2012

Getting Savings from Decreasing Variation: Not as Easy as it Might Seem


Today’s Managing Health Care Costs Indicator is 45%

Click on image to enlarge.  Source 
The Dartmouth Atlas  project has been identifying huge unexplained unwarranted variation in health care for decades – and variation as a cause of health care inflation became part of the broader health policy discussion with Atul Gawande’s Cost Conundrum published in the New Yorker in 2009.
Decreasing variation is attractive as a source of medical savings because virtually all providers deeply believe that it’s others who are overutilizing.   However, there are huge problems in harvesting the potential savings from decreasing unwarranted variation.   The Institute of Medicine  has shown that much of the variation among different geographies is simply based on different Medicare fee schedules.    That’s not all – the Dartmouth Atlas database uses Medicare only, and Cooper has shown that there is a reverse relationship between Medicare and private payment rates, which offsets some of this variation). The Dartmouth Atlas also historically has not done any type of risk adjustment.

This month’s Health Affairs has another cautionary note. Makarov and colleagues show that in high utilization regions, low-risk patients with prostate cancer were more likely to get inappropriate imaging, but at the same time high risk patients  were  substantially more likely to get appropriate imaging.  For example, men with low-risk prostate  cancer in New Jersey were 4 times more likely to get inappropriate imaging compared to men  with low-risk prostate cancer in San Francisco.  However, men with high-risk prostate cancer in New Jersey were also three times more likely to get appropriate imaging compared to those in similar circumstances in San Francisco.


This concept, termed the “thermostat model,” posits that each region has a certain proclivity toward resource use that affects both appropriate and inappropriate use. Accordingly, although use varies by region, lower-use regions might not necessarily concentrate their resources on appropriate care.

The likelihood that patients got imaging that was concordant with evidence-based guidelines was disappointing.

More than 45 percent of men with low-risk prostate cancer underwent guideline-inappropriate imaging, and only two-thirds of men with high-risk disease had appropriate imaging evaluations.

 It’s an elegant study, using the SEER (Surveillance, Epidemiology and End Results) Medicare database. This means that the number in the study is large, 29,053, and there are not likely variations in coverage or plan design that could explain these differences.  The authors segment the patients based on National Comprehensive Cancer Network guidelines that were in place during the time of the data collection.
Clearly, variation plays a role in elevated health care costs in high cost regions of the country.  However,  geographies with low utilization have heterogeneous providers – some of whom use resources wisely, and others who simply give too little care.   Further, regions that tend to do a lot of imaging (or surgical procedures, or almost anything else) have more capacity- and use this capacity for both evidence based medicine (decreased undercare) and for unnecessary services (increased overutilization).

We need to be careful not to promote undercare as we push to decrease variation.


Thursday, April 19, 2012

The Market Works (when properly structured)


Today's Managing Heath Care Costs Indicator is $42 Billion


Durable medical equipment has been a conundrum for Medicare for decades; cable tv ads for scooters give us a sense of the profit margin in this space.   In many states, including Florida and Louisiana, fraud in home care and medical devices is a substantial underlying cause of high costs.

The New York Times and others report today that a pilot program requiring durable medical equipment vendors to bid to provide services to Medicare beneficiaries has been a big success.   This is a bold move -- restricting Medicare beneficiaries to a small number of suppliers who guarantee service levels and price.   No surprise that there has been robust opposition, including a congressional ban on this bidding that was reversed by the Affordable Care Act.  It's a bit distressing to see those promoting market forces opposing this program.  Small, local, high-cost providers will advocate to maintain their business and their profit margins.

The program in nine cities shaved costs by 42%.  CMS projects that nationwide savings from expansion of this program could reach $42 billion, including over $17 billion in decreased out of pocket costs for Medicare beneficiaries.   (Initial pilots probably focused on geographies with high costs, so savings rates from expansion will be lower than from the initial pilots).

Competitive bidding could be applied to pharmaceuticals and other purchasing.   Medicare is a large, high leverage purchaser, and we need CMS to vigorously use its leverage to increase value.  Pharmaceuticals next?  No one will go quietly!

Tuesday, April 17, 2012

What's the Right Price for Drugs?

Today's Managing Health Care Costs indicator is $93,000


Pharmaceuticals are one of the great bargains in health care.   Drug inflation has been low for years, with more and more blockbusters going generic.  When drugs lose their patent protection, prices often drop by as much as 90% in just a year.  


But a tiny portion of all prescriptions represent a startling portion of all costs.   Brand name drugs that retain patent protection represent only about 20% of all prescriptions, but 70% of total pharmacy costs.   Specialty drugs, which can cost hundreds of thousands per year, are going up in price rapidly.   Provenge, a prostate cancer vaccine treatment, costs $93,000  There are no choices-  the payer pays the price, or the patient is denied the medication.

What can we do to lower the price of branded medications?

Price control

The US is one of the few developed countries which does not regulate brand name drug prices.  We also have the highest unit costs for drugs around – which makes sense since prices are associated with wealth, and we have the highest GDP. However, our prices are even higher than our GDP alone would suggest they should be.  We are ideologically opposed to price controls - and not likely to adopt them soon.

Bargaining

It’s tough to bargain when there is only a single product, and no substitutes.   In many classes of drugs, there are reasonable substitutes (that are not chemically identical.)  It’s easier to get a lower price if the purchaser can restrict coverage of drugs not chosen, called a “closed formulary.”  This is an instance where full consumer choice and affordability don't easily cohabit.

Bargaining got substantially less effective in the United States with OBRA 1990, which mandated that Medicaid get the lowest prices.  This made pharmaceutical companies much more reluctant to give deep discounts to high leverage purchasers.   The Medicare Part D enabling legislation also prohibited the federal government from negotiating pharmaceutical pricing for Medicare beneficiaries.  We could get the lowest prices by negotiating with the largest leverage. It’s no surprise the pharmas oppose this!

Patient cost sharing

Patients use less of a good or service when they have to pay more for it.  There’s been dramatically more cost-sharing with patients in recent years, and this has increased consumer price sensitivity.  Pharmaceutical companies have countered by offering discounts and copay waiver cards – which sound like a good idea at first, but do end up raising costs for everyone by making higher prices sustainable. http://managinghealthcarecosts.blogspot.com/2010/10/drug-discounts-which-raise-health-care_17.html . Pharmas are now sponsoring legislation to limit  patient out-of-pocket spending on ‘tier four’ medications where health plans have made patients responsible for a percentage of acquisition cost rather than a copayment.  This sounds good –but will help pharmaceutical companies maintain high prices.  


Evidence based prescribing

We can lower the cost of drugs by simply only prescribing them when they are actually necessary.   A huge portion of antibiotics prescribed are unnecessary – and recent evidence suggests that we’re even overprescribing statins.  Many diabetics are on very expensive second line medications, when they should be on insulin.  

Substitution

Avastin is a chemotherapy agent that can be split into small doses (cost $50 per dose) to treat macular degeneration. The manufacturer would rather sell small doses of Lucentis, an equivalent medication – for $2000.   The drugs are not identical, and only Lucentis has FDA approval for ophthalmologic use.   But can we really afford to spend 40 times the cost to get equivalent outcomes?
Disease prevention

Of course, if we could get Americans exercising and eating fewer calories, we could have a lot fewer lifestyle related diseases that lead us to use medications in the first place.  Many of the interventions to make Americans healthier are public health interventions that are relatively low cost. The payback for this will be long term, but the benefits go far beyond lower drug costs.

For the short term, price regulation is almost inconceivable in the US.  We should seek to advantage generic medications wherever possible, and position health plans (and the government) to get the best possible prices. We should promote cost-effective substitution, and review pharmaceutical industry promotions and try to prevent those that improperly promote the use of cost-ineffective medications.


We should keep our eyes on  specialty drugs, especially those custom-manufactured using the patients’ or her cancer’s genetic material.  For these drugs, it’s hard to know what the “right” price really is.

Another Graphic Way to Show Cost of Health Care Reform in MA

Reference 

Monday, April 16, 2012

More Good News from Massachusetts

Today’s Managing Health Care Costs Indicator is $453 Million

The blogosphere has focused a lot of attention on Massachusetts, where almost everyone (97+%) has health insurance as a result of health care reform that looks almost exactly like the Affordable Care Act.  Our costs in this state are exceptionally high – although they are rising more slowly than costs in other states.

A study released last week by the Massachusetts Taxpayer Foundation  – a nonpartisan group that advocates for good government (including promoting prudence in spending) – shows that it cost the state an additional $453 million, or  an incremental $91 million on the average for each of the last five years to extend coverage to another 7.6% of the population.   The total cost was a bit over $900 million –the additional amount was spent by the federal government for Medicaid and waivers,  employers who increased the portion of the population insured during this time period despite the recession, and individuals who purchased insurance and who would have otherwise gone “naked.”

It’s not perfect for states to go this alone.  Massachusetts hospitals on the New Hampshire border are already seeing higher rates of bad debt due to the difficulty of obtaining affordable insurance to the north.

And the total dollars being spent are not inconsequential.    However, incremental spending to support expanded coverage is equivalent to 1.4% of the total state budget. Seems like a good deal.

Friday, April 13, 2012

When Health Care Employment Rises, Health Care Costs Will Go Up

Today’s Managing Health Care Cost Indicator is 2.8 million
Click image to enlarge 

Research from the Center for Health Workforce Studies (Albany)   shows that between 2000-2010 the health care workforce represented more than 100% of the increase in employment for the entire country.  Overall number of jobs decreased by 2%, while health care jobs increased by 25%.  The non-HC sector lost 6 million jobs from 2000-2010, while the health care sector gained 2.8 million jobs.  

Health care jobs are well-paying, good jobs. That’s why health care can represent 18% of the GDP but less than 10% of total employment.  Low skilled jobs (janitorial and food service) were the only place where there were fewer jobs in health care in 2010 compared to 2000.

The calculations, derived from Department of Labor/ Bureau of Labor Statistics, suggest that we will create net new jobs over this decade –but again health care will represent a disproportionate share of these jobs.   Health care represented 9.8% of jobs in 2010, and is projected to represent 11.2% of jobs in 2020.
Click Image to Enlarge

These are only projections, and there are some good reasons for increased employment in health care.  Our population is aging, which leads to higher health care costs.  Projections are also usually wrong;  few projected in 2002 that the last decade would have concluded with fewer jobs.    The Bureau of Labor clearly doesn’t see technology leading to displacement of labor in health care.    I’d guess that there will be more savings due to increased use of technology than these estimates suggest.

There is a straightforward relationship between health care job creation and health care inflation.  As long as we are predicting more jobs in health care, we have to conclude that health care costs will continue to rise.  

Previous posts on this subject here and here 

Thursday, April 12, 2012

Misleading Reporting


Today’s Managing Health Care Costs Indicator is $6,058

Here’s the first paragraph of an article from the Boston Herald   abstracted by Commonhealth   yesterday:

The nation’s anemic economic recovery could suffer a brutal blow at the hands of Obamacare, critics say, as a new study shows mandated health care in Massachusetts cut $6,000 from some Bay State residents’ annual pay.


Here’s the conclusion from the actual paper.


Our results suggest that mandate-based reform has the potential to be a very efficient approach
for expanding health insurance coverage nationally.

The same researchers previously reported that health care reform in Massachusetts decreased the number of uninsured, and


Using new measures of preventive care, we find some evidence that hospitalizations for preventable conditions were reduced. The reform affected nearly all age, gender, income, and race categories. We also examine costs on the hospital level and find that hospital cost growth did not increase after the reform in Massachusetts

So – the researchers conclude that there is less “dead weight loss” from a mandate than from a broad-based tax to cover health care costs.  Further, Massachusetts iscovering more people and not spending appreciably more.  The Connector Authority (our health insurance exchange) is set to announce a second year of premium decreases.  

Health Care Reform in Massachusetts is working – the Herald headline notwithstanding.

Tuesday, April 10, 2012

Infographic: How We Spend Our GDP

Today's Managing Health Care Costs Indicator is 13%
This month's Atlantic Monthly has two interesting infographics about how we spend our GDP in the United States.  We spent 4.8% on health care in 1947, 8.1% in 1967, and it's up to 18% as of 2007.  It's also striking how much less of the GDP we spent in 2007 on government services. In fairness, this has gone up through the Great Recession with increases in government services for those who faced financial hardship.

This doesn't all represent 'crowd out.'  Far fewer Americans grow or process food - so no surprise we're spending less on this.  The decrease in percentage of GDP going to education is especially scary, though. 


Click image to enlarge.  Source
Click image to enlarge.  Source 

Monday, April 9, 2012

The Cautionary Tale of Fenofibrate

Today's Managing Health Care Costs Indicator is $700 million 
Source. Click image to enlarge 


The Archives of Internal Medicine has an illuminating narrative today about how Abbott Pharmaceuticals managed to maintain effective brand name pricing for this questionably-effective lipid medication for over TEN YEARS after its patent expiry.   The authors had an earlier paper showing the striking different use of fenofibrate in Canada compared to the US  - which I linked to in 2011. The annual cost to health care consumers and purchasers: $700 million!

Abbott’s plan, called “a novel and especially clever approach” in the accompanying editorial:

1) Sue potential generic manufacturers for patent infringement. This netted Abbott 30 additional months without generic competition
2) During this 30 month window, Abbott filed for a new formulation – with a slightly different number of milligrams per pill. The drugmaker did no new studies to show clinical efficacy –but rather simply showing that the new formulation was equivalent to the older formulation
3) Before the generic came out – Abbott moved 97% of all patients off the drug that would be substitutable, and to the “new” drug for which a generic had not yet been approved.  

Although the new drug was equivalent to the old one, generics could not be substituted.

4) When a generic was just about to come out for the second formulation – voila – Abbott introduced a third formulation – again showing only equivalency to the old formulation, and again preventing generic substitution.   The company only convinced 96% of patients to switch to the new, equivalent, nonsubstitutable brand name medication this time.

During this time, large studies failed to show survival or cardiac benefit to treatment with fenofibrate, which nonetheless was aggressively marketed.  Rates of use of this medication continued to rise!

The authors suggest a number of solutions to this problem – which could have been addressed by better regulatory efforts, a mandate to allow substitution for equivalent drugs, or prescribing physician unwillingness to go along with this decade-long charade.  

H/T to Marilyn Mann for pointing out this article.

Sunday, April 8, 2012

Medical Claims: Don’t Always Believe the Numbers

Today’s Managing Health Care Cost Indicator is 17,000

Click on image to enlarge.  Source
Two articles that have caught my attention over the last few days demonstrate that claims data doesn’t always tell the truth.

A report in the April 4 JAMA shows that while claims data suggests that there has been a dramatic decline in hospital admissions for pneumonia – much of that decline is accounted for by a coding change  More hospitals are billing sepsis with pneumonia. There’s still a decline –it’s just not nearly as impressive.    The implication – the accuracy of claims data over sequential time periods can be undermined by changing coding incentives. I’m sure you can imagine which of these diagnoses has a higher associated payment!

Sarah Kliff of the Washington Post’s WonkBlog picked up a letter to the editor from BMJ  which pointed out a series of absurd conclusions one could draw from billing statistics. The NHS data set suggests that there were 1700 MEN in the UK who received services associated with…. Pregnancy.

Claims data is critical for health services research and policy.  The advantages of claims data over chart review include:
- Well structured with agreed-upon definitions
- Includes all billed services, regardless of where these services are delivered.
- Inexpensive to obtain and to analyze

Here’s why claims data doesn’t always give us the right answer, though

- Plain carelessness.
o A number of years ago I saw a contention that claims for vaginal births for women who had a Caesarian section represented fraud.  Not really – just careless billing practices.

- Gaming.
o Remember – providers bill to get paid. They tend to adapt their billing practices to maximize the amount they will get paid.  If sepsis with pneumonia pays more than pneumonia with sepsis – well, you know what happens.  
o It’s likely that full coverage for preventive care will convert many previous problem-oriented visits to preventive visits. The content of care will not necessarily change – but the way it’s covered will.

- Local area variation
o In Eastern Massachusetts, pediatricians historically didn’t bill for vaccinations, since the serum was supplied by the state.  The state usually had one of the highest rates of childhood vaccination in the country according to the CDC, but you couldn’t have guessed this from reviewing claims data!

Claims data will continue to play a critical role in helping us evaluate the impact health care policy.  When the data doesn't make sense, though, we'll have to question it.

Saturday, April 7, 2012

Hepatitis C: A Growing Threat, and a Missed Opportunity


Today's Managing Health Care Costs Indicator is 3.2 million

Imagine that there is an infection which can be detected through screening.   There is an effective but expensive treatment, and many of those who suffer from the disease will die prematurely without detection and treatment.  Further, imagine that those who don’t know they have the disease will transmit the infection through sex or through shared needles – leading to preventable deaths and disabilities of hundreds of thousands more. 

This sounds like South Africa under Thabo Mbeke in the late 1990s  - where the government denied that HIV was the cause of AIDS, and refused to fund screening or treatment.  Researchers believe that 365,000 died due to the inaction of the South African government.
An article in JAMA last month reminds me that we don’t have to look very far to see a similar avoidable tragedy unfolding.   

In the United States, Hepatis C is a scourge.   About three quarters of those infected get chronic hepatitis.  Two thirds of these have active liver disease and a quarter of those get cirrhosis. The viral infection causes liver cancer, and is the largest cause of liver failure (and transplantation) in the US.    There is no vaccine, but a handful of (expensive) antiviral medications have recently been shown to be effective in lowering viral count, reducing new infections. There are recent reports that antiviral therapy has led to actual cures – a result we still haven’t achieved with highly active antiretroviral therapy for HIV infection. 

There are 3.2 million Americans with Hepatitis C – and most of them (66-75%) don’t know they have it.  About a million of those with Hepatitis C  pass through the US correctional system each year – so we could diagnose many of these cases through voluntary testing.  We could also treat newly-found cases of Hepatitis C – which could prevent future liver failure and prevent infection of others. It wouldn’t be easy, of course. The current drugs cost $30-60,000 for a 12 week course of treatment – it’s hard to imagine coming up with that kind of money in the prison system.   Just like high drug prices make it hard to imagine South Africa treating all of its HIV-infected individuals with expensive HIV drugs in the days before generics were available.  

We should  start diagnosing and treating prisoners who have Hepatitis C.   We also need to negotiate aggressively with the pharmaceutical industry to lower the prices of these lifesaving medications when they are purchased in bulk.  Hepatitis C killed more Americans than HIV last year!   We should not stand by and watch a public health failure like that of South Africa in the late 1990s. 

Thursday, April 5, 2012

Affordable Care Act Insurance Company Rebates


Today’s Managing Health Care Costs Indicator is $1.93 billion


The Commonwealth Fund released a study today estimating that insurers would have had to refund almost $2 billion to employers and consumers in 2010 if the Affordable Care Act provisions requiring “medical loss ratios” of at least 80-85% were in place.    

The paper reviews MLR methodology  -and points out that the Affordable Care Act has a broader definition of medical cost than that traditionally used by actuaries – including quality and antifraud programs, excluding tax payments from consideration, and allowing for additional administrative cost for plans with very few members.  A number of states have received waivers – and the decreased rebates due to waivers is modeled in the calculations.

The rebates would have been highest in the individual market (53%; an average of $183 per policy), but lower for small group (24%; $85 per policy) and lowest for large group (15%; $72 per policy).  This is not necessarily because health insurance plans are fleecing individuals.  The MLR includes everything besides for claims costs paid to providers, and the marketing and administration costs are much higher for policies sold to individuals compared to policies where a single signature arranges insurance for hundreds or thousands of policyholders.

Some states already regulate MLR – and no insurers would have owed rebates for individual insurance in Hawaii, Rhode Island and Vermont, while 98% of the market would be owed rebates in Kentucky, and 95% in Arizona. Insurers representing 12% of the Minnesota market would have owed rebates, even though that state prohibits for-profit insurers. 

I wouldn’t expect that health care costs would have been $2 billion lower if the ACA had been in place in 2010.   There is considerable judgment in determining what is a medical cost and what is a nonmedical cost.  When insurer stock price soared with low MLRs, health plans were more likely to count slightly clinical services as nonmedical.  With regulations to prevent low MLRs, health plans will do all they can to move arguably nonclinical costs into the medical loss ratio.  

While the MLR ratio requirements won’t save as much money as suggested in this white paper – it does put pressure on health plans to reduce nonmedical costs.  That pressure will force tiny plans to consolidate, which will help them increase efficiency. It discourages health plan arms races that lead to inordinate investments in expensive marketing.  It is likely to put downward pressure on brokers’ fees– and lead to health plan products that are simpler to administer and need fewer explanations. This regulation pressures the individual health insurance market to deliver health care products that have far more value to health care consumers (aka patients.) 

That seems like a great idea to me.


Click on image to enlarge. Source 

Wednesday, April 4, 2012

Medical Societies Identify Unnecessary Tests and Procedures

Today’s Managing Health Care Cost Indicator is 45


The American Board of Internal Medicine Foundation published its compendium of five tests that each of nine specialty societies have agreed don’t usually offer any value to patients, and that we should not routinely order.  Each list can be accessed at this link.

I’ve mentioned the oncologist and internal medicine recommendations in past posts.  Some of my colleagues feel that the recommendations are not enough – but I think they’re a GREAT first step.  Once we have agreement about what tests and procedures aren’t worth doing, we can start measuring how often we’re doing them.  We can improve what we measure – and it’s terribly hard to decrease variation and decrease waste when we can’t measure it because we don’t agree about definitions.

There are things missing in this set of unnecessary tests.  For instance the otolaryngologists didn’t finger the inappropriate and highly remunerative upper respiratory endoscopies. Still, most of us know some gastroenterologists who recommend followup colonoscopies at too short an  interval – and having the American Gastroenterologic Association explicitly say that this is inappropriate can save money, can save time, and can save potential iatrogenic harm.

Social norms are important, and the ABIM Foundation has made it tough for specialty societies NOT to participate.  Eight more specialty societies will come up with their “top five” list of tests and procedures that physicians and patients should question this fall.

Public transparency is also important, and the ABIM Foundation is collaborating with a group of consumer organizations including Consumer Union (publisher of Consumer Reports) to let our patients know about these recommendations.  It’s nice to see providers taking on the critical issue of overutilization of tests and procedures with little or no incremental value.

Tuesday, April 3, 2012

Diabetes Care: The Spectrum of Success

Today’s Managing Health Care Costs Indicator is  8.3%

Diabetes is a major killer in the US – the disease strikes about one in twelve  Americans ( 8.3% in the entire population; one in four over age 65), is responsible for over 70,000 deaths, and is the leading cause of blindness and kidney failure.   The Centers for Disease Control and Prevention estimates that the annual cost of diabetes in the US is $168 billion in medical treatment, and $58 billion in lost productivity.

I’m struck by two studies published in the last week that use diametrically opposed approaches –and both appear to work.  (Both studies are small, though , so it’s possible that the results will not be sustained in larger samples).

The NEJM  published two studies showing that intensive surgical intervention helps.   Italian researchers showed that bariatric surgery (the most invasive surgical treatments) could “cure” diabetes in 75-95% of those treated, compared to NO cures in the medically treated group.  American researchers showed that those who had less-invasive surgical treatments were three times as likely to have an excellent diabetes control (Hemoglobin AIC of <6).   The conclusion –for diabetics with morbid obesity, surgical treatment is strikingly effective.  Other  studies have shown that bariatric surgery can pay off in a few years in the general population – this set of studies provides further evidence that we should cover this expensive ($11-$26,000) procedure for those with morbid obesity.

The Annals of Internal Medicine published an elegant study  which randomized 118 African American veterans with diabetes to usual care, financial rewards ($100-$200), and peer mentoring.  The financial reward for better HbAIC led to a 0.4% average decrease in HbAIC, while the peer mentoring led to a 1.1% decrease in HbAIC.

There are often many roads that lead to the right outcome in health care – and these studies are all small and did not include similar groups – so shouldn’t be compared.   It’s nice to know that both high tech and low tech solutions can have a substantial impact, and have the potential to decrease diabetic complications in our increasingly-obese population.

Sunday, April 1, 2012

A Tough Week


Today’s Managing Health Care Costs Indicator is Five


It’s been a tough week for health care wonks of my persuasion.  

The Supremes – or at least the all-important Anthony Kennedy – suggested that the individual mandate could be toast, which would mean that the Affordable Care Act would insure millions fewer Americans.  Scalia et al suggested that if the mandate fell, the Court should invalidate the entire law, which would mean years or decades before we start trying the many good ideas embodied in this bill – including a path to generic biologic drugs, more comparative effectiveness research, and pilots to bundle payment.   The ACA is imperfect – but is chock full of good ideas for how to improve value in health care.  Many of these ideas won’t work as well as we would hope – but if we aren’t experimenting responsibly, our health care cost crisis will just continue to get worse and worse.

We need five justices to uphold the mandate, or at least to fail to declare the entire ACA unconstitutional. 

Two studies that came out this week also heightened my sense of malaise.  

The Premier Medicare Pay for Performance pilot – in which a group of 252 hospitals could earn bonus payments for improving certain quality metrics – showed no effectiveness whatsoever in lowering 30 day mortality.  NOW- this project wasn’t aiming to lower mortality. The bonuses were to encourage higher scores in certain evidence-based quality metrics – such as use of beta blockers and aspirin for heart attacks  and rapid antibiotics for pneumonias.   The reasoning was that this could improve quality and lower costs.
 Click Image to Enlarge. Source 

There are a lot of reasons why the Premier Medicare project might not have worked

·      The quality metrics might not actually be associated with lower mortality (good ideas –but not effective at diminishing death rates)
·      30 day mortality might be a bad metric itself – perhaps the hospital has more control over 15 day mortality, or 45 day mortality
·      The risk adjustment could have been flawed
·      The incentive might not have been large enough. The incentive was distant from the action, and although there was a potential penalty, hospitals could drop out if they faced a penalty.
·      The communication with the thousands of medical staff of these hospitals might have been ineffective


But all of this is whining.  Bottom line – this is  a deeply disappointing study.    Kudos to CMS, Premier, and Jha et al for publishing these negative results.  The only way to move forward effectively is to publish both positive AND negative results.

Ashish Jha had a double header in the NEJM last week – he also had an editorial suggesting that the emphasis on preventing hospital readmissions might be misdirected.  Hospital readmissions are staggering in the US Medicare population (almost one in five in 30 days).  However, readmissions are much lower in those under 65.   Further, Jha points to a literature review from the Canadian Medical Association Journal (The JAMA of the North) that showed that with clinical record review less than 12% of readmissions were judged to be preventable.  Overall only 2.2% of discharges led to a preventable readmission in this literature review.  Jha points out that penalties for high readmission rates could inadvertently penalize hospitals with lower mortality rates (who discharge patients who are by definition sicker).  Emphasizing the “wrong” measure draws our attention from other areas that may lead to better outcomes or more cost savings.

Now that we see coherent arguments against focusing too much attention on the “core measures” in the Premier demonstration and readmission rates, we just have to identify  on which metrics we SHOULD focus our attention.