Tuesday, April 24, 2012

GAO Faults Medicare Advantage Bonuses


Today’s Managing Health Care Costs Indicator is $8.35 billion


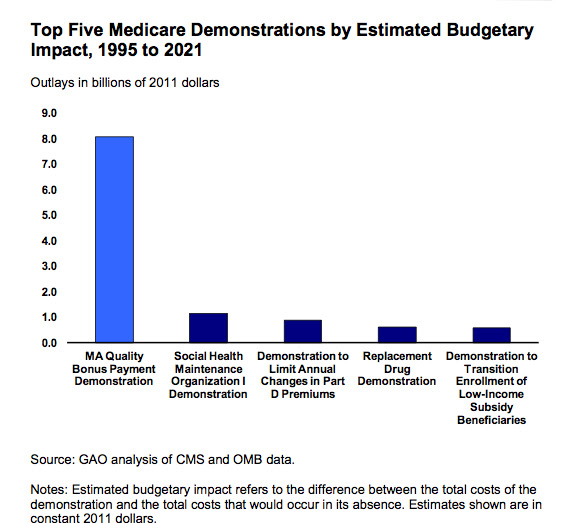
Yesterday the Government Accountability Office (GAO) issued a stinging report on the CMS demonstration project that awards much higher quality bonuses to Medicare Advantage (MA) plans than were outlined in the Affordable Care Act.    The total incremental cost of these bonuses will be $8.35 billion over 10 years.  Most of the increased dollars will go to health plans with “average”  three star ratings (in the five star system).    The remainder of the dollars are spent because these bonuses will prevent loss of membership by MA plans.   The GAO reports that the population covered by bonuses will increase from about 1/3 of beneficiaries to about 90%. This analysis is based on a Kaiser Family Foundation analysis,which notes that 60% of MA beneficiaries were in 3 and 3.5 star plans in 2011.

These quality bonuses will be based on past performance ,  in many instances performance that predated the announcement of the demonstration project. This means that it will be almost impossible to assess the quality impact.  The demonstration project is not budget neutral, and wipes out about 1/3 of the savings that the Affordable Care Act obtained from cutting health plan payments. The total dollar amount exceeds all other CMS demonstration projects combined.

It’s a scathing report –but the stock market reacted not at all.   Humana, United Health Care, Aetna Cigna and Wellpoint all had just small changes in their stock price – not in a consistently downward direction.  It’s possible that Wall Street already knew this information – since the KFF report came out last year.  It’s likely that analysts believe that the Department of Health and Human Services will not follow the GAO recommendations, and this poorly-designed demonstration project with these extra payments will continue.

Monday, April 23, 2012

Getting Savings from Decreasing Variation: Not as Easy as it Might Seem


Today’s Managing Health Care Costs Indicator is 45%

Click on image to enlarge.  Source 
The Dartmouth Atlas  project has been identifying huge unexplained unwarranted variation in health care for decades – and variation as a cause of health care inflation became part of the broader health policy discussion with Atul Gawande’s Cost Conundrum published in the New Yorker in 2009.
Decreasing variation is attractive as a source of medical savings because virtually all providers deeply believe that it’s others who are overutilizing.   However, there are huge problems in harvesting the potential savings from decreasing unwarranted variation.   The Institute of Medicine  has shown that much of the variation among different geographies is simply based on different Medicare fee schedules.    That’s not all – the Dartmouth Atlas database uses Medicare only, and Cooper has shown that there is a reverse relationship between Medicare and private payment rates, which offsets some of this variation). The Dartmouth Atlas also historically has not done any type of risk adjustment.

This month’s Health Affairs has another cautionary note. Makarov and colleagues show that in high utilization regions, low-risk patients with prostate cancer were more likely to get inappropriate imaging, but at the same time high risk patients  were  substantially more likely to get appropriate imaging.  For example, men with low-risk prostate  cancer in New Jersey were 4 times more likely to get inappropriate imaging compared to men  with low-risk prostate cancer in San Francisco.  However, men with high-risk prostate cancer in New Jersey were also three times more likely to get appropriate imaging compared to those in similar circumstances in San Francisco.


This concept, termed the “thermostat model,” posits that each region has a certain proclivity toward resource use that affects both appropriate and inappropriate use. Accordingly, although use varies by region, lower-use regions might not necessarily concentrate their resources on appropriate care.

The likelihood that patients got imaging that was concordant with evidence-based guidelines was disappointing.

More than 45 percent of men with low-risk prostate cancer underwent guideline-inappropriate imaging, and only two-thirds of men with high-risk disease had appropriate imaging evaluations.

 It’s an elegant study, using the SEER (Surveillance, Epidemiology and End Results) Medicare database. This means that the number in the study is large, 29,053, and there are not likely variations in coverage or plan design that could explain these differences.  The authors segment the patients based on National Comprehensive Cancer Network guidelines that were in place during the time of the data collection.
Clearly, variation plays a role in elevated health care costs in high cost regions of the country.  However,  geographies with low utilization have heterogeneous providers – some of whom use resources wisely, and others who simply give too little care.   Further, regions that tend to do a lot of imaging (or surgical procedures, or almost anything else) have more capacity- and use this capacity for both evidence based medicine (decreased undercare) and for unnecessary services (increased overutilization).

We need to be careful not to promote undercare as we push to decrease variation.


Thursday, April 19, 2012

The Market Works (when properly structured)


Today's Managing Heath Care Costs Indicator is $42 Billion


Durable medical equipment has been a conundrum for Medicare for decades; cable tv ads for scooters give us a sense of the profit margin in this space.   In many states, including Florida and Louisiana, fraud in home care and medical devices is a substantial underlying cause of high costs.

The New York Times and others report today that a pilot program requiring durable medical equipment vendors to bid to provide services to Medicare beneficiaries has been a big success.   This is a bold move -- restricting Medicare beneficiaries to a small number of suppliers who guarantee service levels and price.   No surprise that there has been robust opposition, including a congressional ban on this bidding that was reversed by the Affordable Care Act.  It's a bit distressing to see those promoting market forces opposing this program.  Small, local, high-cost providers will advocate to maintain their business and their profit margins.

The program in nine cities shaved costs by 42%.  CMS projects that nationwide savings from expansion of this program could reach $42 billion, including over $17 billion in decreased out of pocket costs for Medicare beneficiaries.   (Initial pilots probably focused on geographies with high costs, so savings rates from expansion will be lower than from the initial pilots).

Competitive bidding could be applied to pharmaceuticals and other purchasing.   Medicare is a large, high leverage purchaser, and we need CMS to vigorously use its leverage to increase value.  Pharmaceuticals next?  No one will go quietly!

Tuesday, April 17, 2012

What's the Right Price for Drugs?

Today's Managing Health Care Costs indicator is $93,000


Pharmaceuticals are one of the great bargains in health care.   Drug inflation has been low for years, with more and more blockbusters going generic.  When drugs lose their patent protection, prices often drop by as much as 90% in just a year.  


But a tiny portion of all prescriptions represent a startling portion of all costs.   Brand name drugs that retain patent protection represent only about 20% of all prescriptions, but 70% of total pharmacy costs.   Specialty drugs, which can cost hundreds of thousands per year, are going up in price rapidly.   Provenge, a prostate cancer vaccine treatment, costs $93,000  There are no choices-  the payer pays the price, or the patient is denied the medication.

What can we do to lower the price of branded medications?

Price control

The US is one of the few developed countries which does not regulate brand name drug prices.  We also have the highest unit costs for drugs around – which makes sense since prices are associated with wealth, and we have the highest GDP. However, our prices are even higher than our GDP alone would suggest they should be.  We are ideologically opposed to price controls - and not likely to adopt them soon.

Bargaining

It’s tough to bargain when there is only a single product, and no substitutes.   In many classes of drugs, there are reasonable substitutes (that are not chemically identical.)  It’s easier to get a lower price if the purchaser can restrict coverage of drugs not chosen, called a “closed formulary.”  This is an instance where full consumer choice and affordability don't easily cohabit.

Bargaining got substantially less effective in the United States with OBRA 1990, which mandated that Medicaid get the lowest prices.  This made pharmaceutical companies much more reluctant to give deep discounts to high leverage purchasers.   The Medicare Part D enabling legislation also prohibited the federal government from negotiating pharmaceutical pricing for Medicare beneficiaries.  We could get the lowest prices by negotiating with the largest leverage. It’s no surprise the pharmas oppose this!

Patient cost sharing

Patients use less of a good or service when they have to pay more for it.  There’s been dramatically more cost-sharing with patients in recent years, and this has increased consumer price sensitivity.  Pharmaceutical companies have countered by offering discounts and copay waiver cards – which sound like a good idea at first, but do end up raising costs for everyone by making higher prices sustainable. http://managinghealthcarecosts.blogspot.com/2010/10/drug-discounts-which-raise-health-care_17.html . Pharmas are now sponsoring legislation to limit  patient out-of-pocket spending on ‘tier four’ medications where health plans have made patients responsible for a percentage of acquisition cost rather than a copayment.  This sounds good –but will help pharmaceutical companies maintain high prices.  


Evidence based prescribing

We can lower the cost of drugs by simply only prescribing them when they are actually necessary.   A huge portion of antibiotics prescribed are unnecessary – and recent evidence suggests that we’re even overprescribing statins.  Many diabetics are on very expensive second line medications, when they should be on insulin.  

Substitution

Avastin is a chemotherapy agent that can be split into small doses (cost $50 per dose) to treat macular degeneration. The manufacturer would rather sell small doses of Lucentis, an equivalent medication – for $2000.   The drugs are not identical, and only Lucentis has FDA approval for ophthalmologic use.   But can we really afford to spend 40 times the cost to get equivalent outcomes?
Disease prevention

Of course, if we could get Americans exercising and eating fewer calories, we could have a lot fewer lifestyle related diseases that lead us to use medications in the first place.  Many of the interventions to make Americans healthier are public health interventions that are relatively low cost. The payback for this will be long term, but the benefits go far beyond lower drug costs.

For the short term, price regulation is almost inconceivable in the US.  We should seek to advantage generic medications wherever possible, and position health plans (and the government) to get the best possible prices. We should promote cost-effective substitution, and review pharmaceutical industry promotions and try to prevent those that improperly promote the use of cost-ineffective medications.


We should keep our eyes on  specialty drugs, especially those custom-manufactured using the patients’ or her cancer’s genetic material.  For these drugs, it’s hard to know what the “right” price really is.

Another Graphic Way to Show Cost of Health Care Reform in MA

Reference 

Monday, April 16, 2012

More Good News from Massachusetts

Today’s Managing Health Care Costs Indicator is $453 Million

The blogosphere has focused a lot of attention on Massachusetts, where almost everyone (97+%) has health insurance as a result of health care reform that looks almost exactly like the Affordable Care Act.  Our costs in this state are exceptionally high – although they are rising more slowly than costs in other states.

A study released last week by the Massachusetts Taxpayer Foundation  – a nonpartisan group that advocates for good government (including promoting prudence in spending) – shows that it cost the state an additional $453 million, or  an incremental $91 million on the average for each of the last five years to extend coverage to another 7.6% of the population.   The total cost was a bit over $900 million –the additional amount was spent by the federal government for Medicaid and waivers,  employers who increased the portion of the population insured during this time period despite the recession, and individuals who purchased insurance and who would have otherwise gone “naked.”

It’s not perfect for states to go this alone.  Massachusetts hospitals on the New Hampshire border are already seeing higher rates of bad debt due to the difficulty of obtaining affordable insurance to the north.

And the total dollars being spent are not inconsequential.    However, incremental spending to support expanded coverage is equivalent to 1.4% of the total state budget. Seems like a good deal.

Friday, April 13, 2012

When Health Care Employment Rises, Health Care Costs Will Go Up

Today’s Managing Health Care Cost Indicator is 2.8 million
Click image to enlarge 

Research from the Center for Health Workforce Studies (Albany)   shows that between 2000-2010 the health care workforce represented more than 100% of the increase in employment for the entire country.  Overall number of jobs decreased by 2%, while health care jobs increased by 25%.  The non-HC sector lost 6 million jobs from 2000-2010, while the health care sector gained 2.8 million jobs.  

Health care jobs are well-paying, good jobs. That’s why health care can represent 18% of the GDP but less than 10% of total employment.  Low skilled jobs (janitorial and food service) were the only place where there were fewer jobs in health care in 2010 compared to 2000.

The calculations, derived from Department of Labor/ Bureau of Labor Statistics, suggest that we will create net new jobs over this decade –but again health care will represent a disproportionate share of these jobs.   Health care represented 9.8% of jobs in 2010, and is projected to represent 11.2% of jobs in 2020.
Click Image to Enlarge

These are only projections, and there are some good reasons for increased employment in health care.  Our population is aging, which leads to higher health care costs.  Projections are also usually wrong;  few projected in 2002 that the last decade would have concluded with fewer jobs.    The Bureau of Labor clearly doesn’t see technology leading to displacement of labor in health care.    I’d guess that there will be more savings due to increased use of technology than these estimates suggest.

There is a straightforward relationship between health care job creation and health care inflation.  As long as we are predicting more jobs in health care, we have to conclude that health care costs will continue to rise.  

Previous posts on this subject here and here